Explore dashboards below
Physical Therapy:
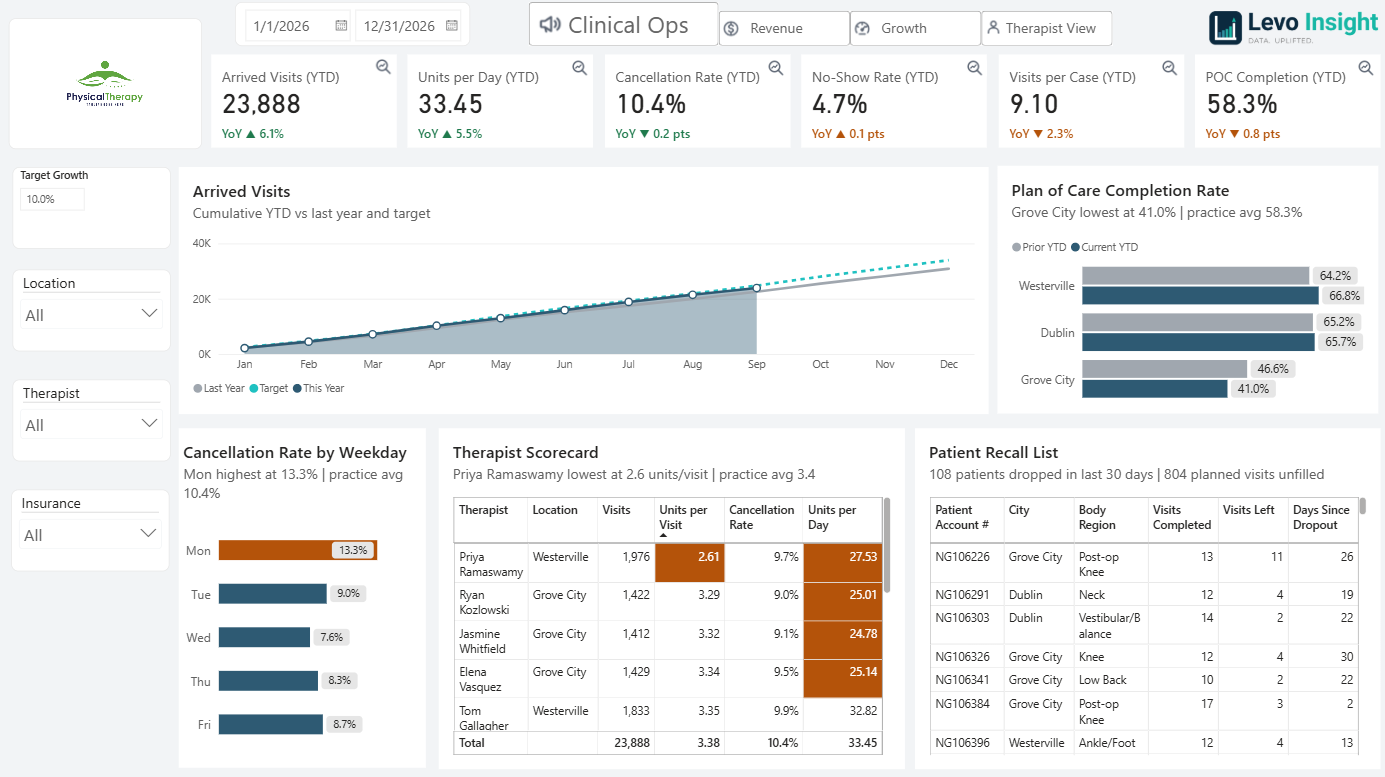
Below is a sample dashboard built for a fictional multi-location physical therapy clinic. All data is simulated, but the setup mirrors what we build for real clients: one place to see how the clinic is doing across visits, billing, and therapists, without digging through separate EMR, billing, and accounting systems.
How to explore it:
- Switch pages with the navigation options at the top of each dashboard: Clinical Ops, Revenue, Growth, and Therapist View.
- Filter with the slicers on the left. Pick a date range, a location, a therapist, or an insurance payer, and every chart updates to match.
- Hover over the KPI cards at the top to view trend lines, and select the magnifying glass to view that chart in more detail.
- Hover over any chart to see exact figures for that month, payer, location, or therapist.
- Each top card shows a year-over-year change: green means improvement over last year, orange means it fell short.
- On Therapist View, pick a therapist to see their individual caseload and performance, the same view a clinic owner would use in one-on-ones.
Auto Body Shop:
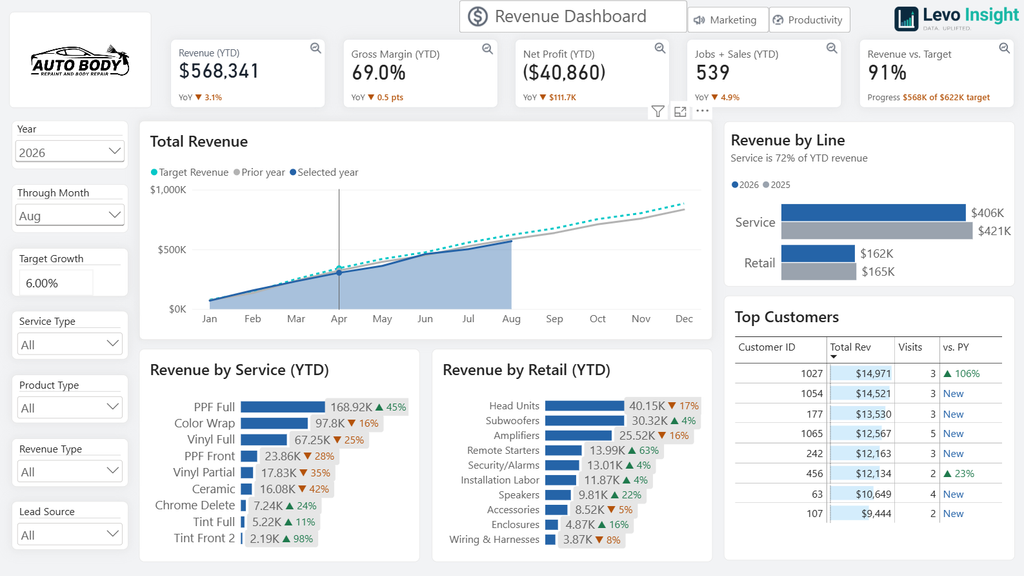
Below is a sample dashboard built for a fictional auto body and accessories shop that does both service work and retail sales. All data is simulated, but the setup mirrors what we build for real clients: one place to see how the business is doing, without digging through separate systems.
How to explore it:
- Switch pages with the navigation options at the top of each dashboard: Revenue, Marketing, and Productivity.
- Filter with the slicers on the left. Pick a year, a month, a service type, or a lead source, and every chart updates to match.
- Hover over KPI cards at the top to view trend lines – select the magnifying glass to view that chart in more detail.
- Hover over any chart to see exact figures for that month, service, or person.
- Each top card shows a year-over-year change: green means improvement over last year, orange means it fell short.