
The doctor who washed his hands and lost his career
Ignaz Semmelweis. If you know this name, I applaud you. I first came across him in Brent Dykes’ book Effective Data Storytelling, and his story has stuck with me ever since, because it’s the clearest example I know of good data losing to poor communication.
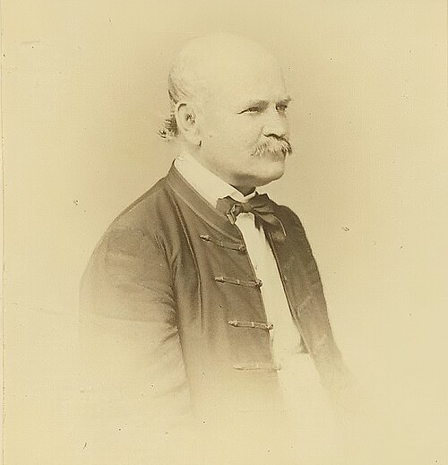
In 1846, Semmelweis was a young Hungarian doctor working in the maternity wards of Vienna General Hospital. The hospital had two maternity clinics: the first was staffed by doctors and medical students while the second was run by midwives. In the first clinic, there was a 1 in 10 chance a mother would die of childbed fever, a condition we now know is a bacterial infection after childbirth. In the midwives’ clinic, the rate was closer to 1 in 25.
Semmelweis wanted to know why. The key difference was that doctors and students started their mornings performing autopsies, then went straight to examining women in labor. Midwives didn’t conduct autopsies. When a colleague of his cut his finger during an autopsy and died of an illness that looked just like childbed fever, Semmelweis became convinced that “cadaverous particles” were traveling from the corpses to the mothers on the doctors’ hands – what we now call germs.
Keep in mind, this was decades before anyone understood germs. Gloves wouldn’t show up in operating rooms until the very late 1800s and handwashing between patients simply wasn’t a thing. So, in 1847, Semmelweis required everyone coming from the autopsy room to scrub their hands in a chlorinated lime solution. Ordinary soap wouldn’t get rid of the smell transferred to doctors’ hands from the corpses which Semmelweis used as proof the particles were still there.
The results were dramatic. Deaths in the first clinic fell from around 10% to about 2% – roughly a 90% drop. Something that drastic should have been celebrated as a breakthrough. Instead, it was largely rejected. Semmelweis wasn’t asking people to take his word for it, he had the numbers to back it up. He believed the numbers would simply speak for themselves – a trap some data analyst fall into – but they didn’t.
His handwashing practice was widely accepted long after his death. As Dykes points out, if Semmelweis had communicated his findings effectively, far fewer mothers would have died waiting for time to break the path for the truth – in Semmelweis’ own words.
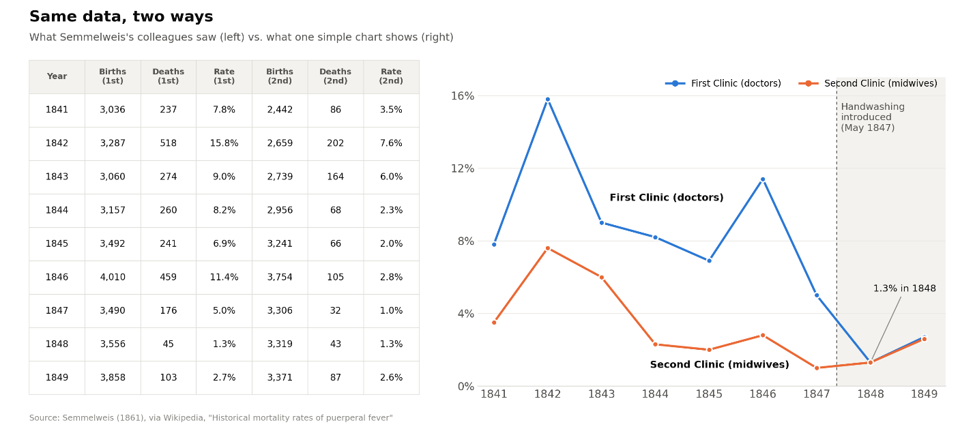
Why weren’t the number enough?
Semmelweis’ colleagues are seen as stubborn but think about what accepting his data meant for them: it meant admitting that they, the doctors, were the ones killing their patients. No table of numbers was going to make that easy to swallow. It’s easy to criticize his peers but truth is we are all like this more than we’d like to admit.
Think about the scale in your bathroom. When it shows a lower number than you expected, you step off and go about your day with a smile. When it’s higher, you check that it’s level, step back on the scale, and shift your weight so there’s not too much on one leg over the other hoping the second reading reveals what you initially expected. Studies have shown that we are much less skeptical of information that tells us something we have already decided to be true or pleases us. Decisions are rarely made by logic alone. How information makes us feel plays a much bigger role than we tend to realize or admit. That doesn’t mean the data matters less, it just means how the data is delivered matters just as much.
With the benefit of hindsight, I see two things Semmelweis could have done differently: tell a story and show a picture.
First, the story. “A 90% drop in mortality” is a statistic. Behind that statistic were real women who came to the hospital to bring a life into our world but instead never went home. Putting faces on the numbers makes them much harder to dismiss. And the research backs this up. A 2022 analysis of 50 studies by Jie Xu found that stories and statistics are about equally persuasive overall, but stories are more effective at getting people to take preventative action, which is exactly what Semmelweis needed his colleagues to do.
Second, the picture. A single, simple chart showing the death rate in the first clinic before and after handwashing would have said more in a few seconds than hundreds of pages of tables. When a grid of numbers is all someone gets, it’s hard to see what’s going on, and easy to find a reason not to look.
What does this mean for your business?
At Levo Insight, every analysis we deliver must meet three criteria: it has to be truthful, valuable, and actionable. Truthful means the numbers are accurate and honestly presented. Valuable means it’s about something that actually affects your business. Actionable means you can do something with it. But as Semmelweis learned, meeting those three criteria isn’t enough if the message doesn’t land.
Here’s what that looks like in practice. Picture a plumbing company whose monthly report shows a callback rate of 6%. As a number in a table, that looks fine, and it’s easy to move past. But when we dig in, we find that one type of job, say water heater installs, accounts for nearly half of those callbacks, and each return trip costs a few hundred dollars in labor and fuel that nobody is billing for. Now the report isn’t “callbacks are 6%.” It’s “water heater installs are quietly costing you thousands a year, and here’s the chart that shows exactly where.” That’s a story an owner can act on this week, not something that surfaces at the end-of-year review.
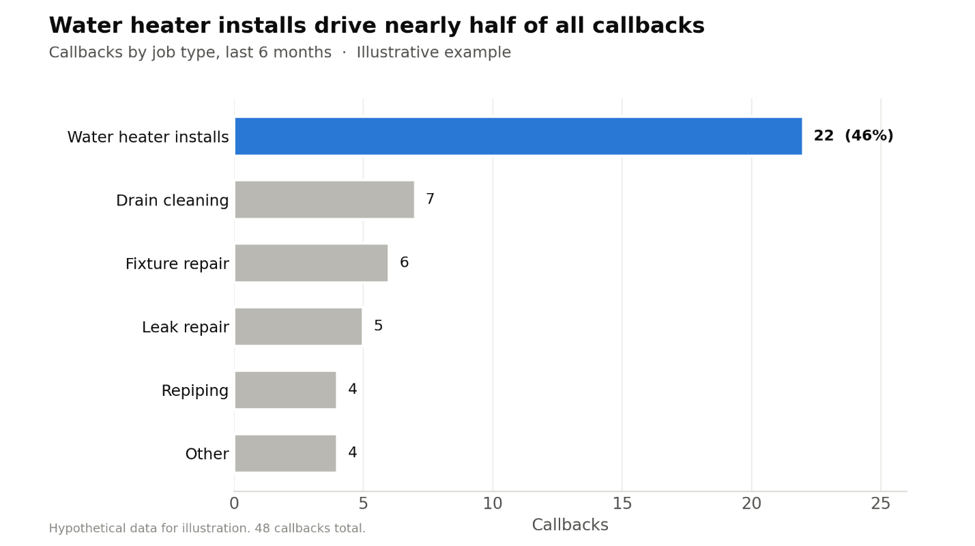
Just like in Semmelweis’ case, the hardest findings are often the ones that point back at how things have always been done. That’s exactly why they need to be communicated with care. None of this is about spin. Storytelling doesn’t change the data. It makes sure the data gets heard. When the numbers are truthful, valuable, and actionable, and they’re delivered through clear visuals and a story people can connect to, business owners stop running on gut feeling and start making faster, more informed decisions. Over time, those decisions add up. Semmelweis had the right answer along with the data to support it and still couldn’t get his peers to entertain his solution. Our job as the data analyst is to make sure your data never has the same problem.