
3 Types of Insight from Data Analytics
Business owners who get dashboards without anyone interpreting them often tell me the same thing: they feel flooded. Revenue, job counts, close rates, cost per lead, margins by service line. Every chart looks like it’s asking for something, but not every number warrants a reaction. Treat every metric as urgent and you end up in a constant state of panic or stress. Treat everything as noise and you miss the opportunities sitting right in front of you.
So which numbers should you focus on, and which can you let go? The honest answer: it depends on the type of insight the number is giving you. Many analytics tools give businesses more data and information rather than actual insight. A dashboard can show you what’s happening – deciding what it means and what to do about it is a separate step.
From Numbers to Insight
In a previous article I covered the three pillars of effective data analytics. I won’t repeat them here but the short version is this: once we understand the context, the numbers, and the visuals behind our data, we can start pulling insight from it. That insight comes in one of three forms: contextual, directional, or actionable.
You may have heard of “actionable insight” as it has become one of those business buzzwords that gets overused to the point that it can mean almost anything (or nothing). Actionable insight is the most impactful of the three, but it isn’t the only kind, and mistaking the other two for it causes real problems. Getting insight matters – knowing how to respond to each type matters more.
If you’ve worked with data before or made decisions based on data, these three types line up loosely with how analysts would describe their work: first describing what happened, then diagnosing why, then prescribing what to do. My version keeps the focus on what owners need, which is how to respond.
Contextual Insight: Good to know, can’t change it
Contextual insight is something we can’t change but it sheds light on the rest of our data. It usually, though not always, comes from outside the business. Examples include rising material costs, interest rates, or a new competitor opening down the road. Seasonality belongs here too – seasonal industries experiencing a dip in revenue in the down months is expected.
The right response is to absorb it and adjust your assumptions. Update pricing, revisit budgets, and reset expectations for the quarter. Even though contextual insight doesn’t call for direct action, it’s still important. When a metric changes dramatically and we have no explanation for it, we haven’t finished analyzing the data. Contextual insight often supplies that explanation. That allows us to adjust where we can and move forward with confidence instead of guessing. A common mistake with contextual insight is trying to fix what you can’t control. You can’t change the cause of a contextual insight but you can change how you consistently respond to it.
Directional Insight: Wirth Watching, Not Yet Worth Acting On
Directional insight is good to know but isn’t mature enough to act on yet. It usually shows up in one of two ways:
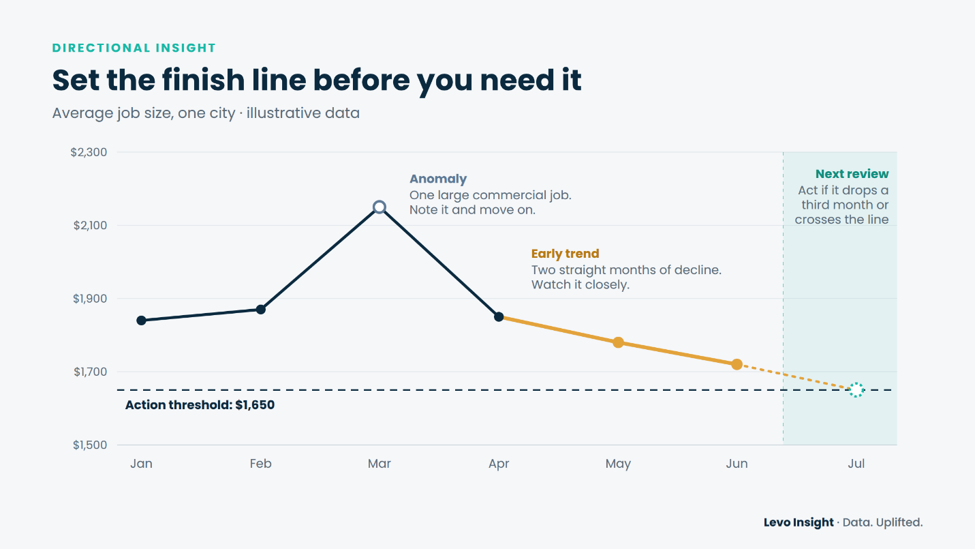
- An anomaly. This is a one-off with a known explanation, such as one huge commercial job skewing the month or a week of rain. Note it and move on.
- An early trend. This is a metric that keeps moving in the same direction over time. This is the one to watch closely.
Spotting a trend early is where data gives you an edge, because you can make changes before you feel the full impact. Directional insight is essentially a warning sign saying: this might be something, or it might be nothing, so let’s watch it closely enough to find out which it is. A good example: average job size in one city has slipped for two months in a row. The right response is to watch, dig, and gather more data. Set the finish line up front with a threshold or timeframe that tells you when it’s time to act. For example: “if average job size in that city drops for a third straight month, or falls below $1,650, we take action.” That way you catch the snowball before it starts rolling, instead of debating it every month.
As you can imagine, a common mistake here is either overreacting to a single data point, or ignoring the signal until it becomes a problem.
Actionable Insight: Clear Gap, Clear Owner, Clear Next Step
Actionable insight identifies an area where we can make a change and measure the results. It’s what makes data analytics powerful. Sometimes it starts as a directional insight that has been watched and confirmed. Sometimes it’s actionable insight the moment you see it. A customer being double billed doesn’t need three months of trending. Either way, actionable insight needs a clear gap and someone who can own the fix. Ideally, it has a clear cause too.
A quick example could be one crew’s revenue per week lags the others by 20%. Digging in shows why. Their jobs are scattered across the service area, so they spend about 40 more minutes a day driving than the other crews. That’s a clear gap with a clear cause we can act on this week. The right response to actionable insight is to decide, assign an owner, set a deadline, and measure the results. Tighten that crew’s routing, give it 30 days, and compare revenue per week again. If it works, roll it out to the other crews. Even crews without the same problem may benefit, which lifts revenue across the board. Start with a small change in one area, measure it, then scale what works. Be cautious of the common mistake of acknowledging the insight and never following through. You see the trend, you know the cause, you have a solution in mind, and nothing changes. This happens more often than you’d think.
How To Tell Which Type You’re Looking At:
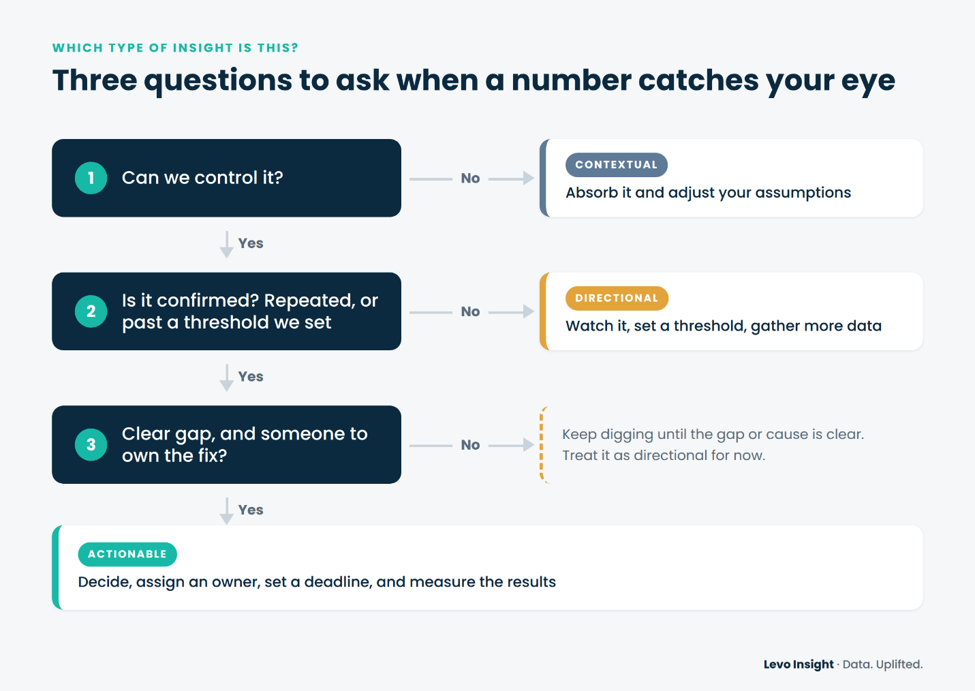
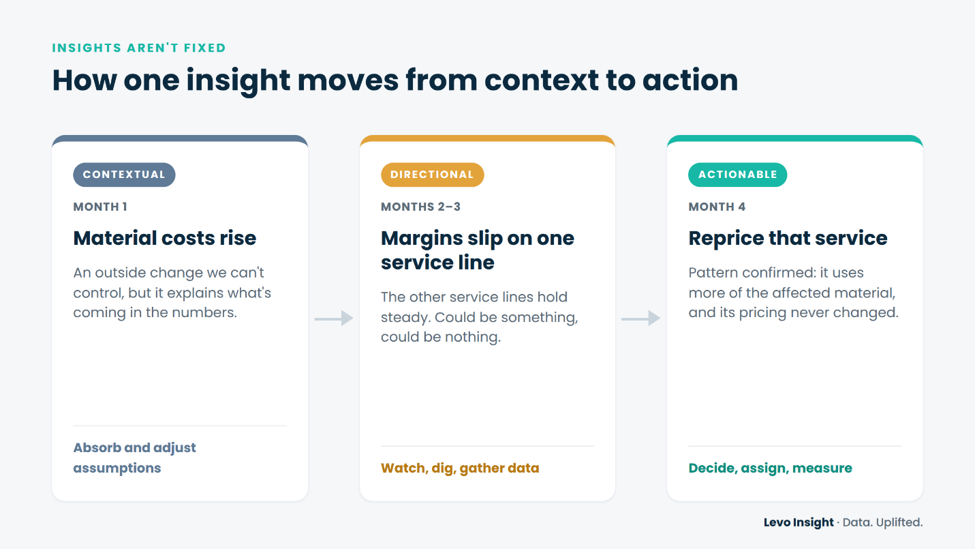
These types of insight are not fixed. A contextual trend can create a directional signal, and a directional signal can become actionable once it’s confirmed. Here’s how that might play out. Material costs rise, which is contextual. A few months later margins on one service line start slipping while the others hold steady, which is directional. Once the pattern is confirmed, the cause becomes clear: that service uses more of the affected material, and its pricing never changed. Repricing that service is an actionable step. Following insight through that progression takes consistent attention over time. That’s hard to do while you’re also running the business. Hiring a data analyst or a team that can respond to each type of insight appropriately is where you can see significant change in your operations.
In every monthly or quarterly report for my clients, I label each finding as contextual, directional, or actionable, so they know at a glance what deserves attention. Contextual insight comes from two places: the industry knowledge clients bring, and the outside context I track that they don’t have time for. I show how it appears in the numbers and where it’s likely coming from. For directional insight, we define what would confirm or dismiss the signal before our next review, so nothing gets overreacted to or forgotten. For actionable insight, I give specific recommendations with expected impact, then track the results and adjust as needed.
Every analysis we deliver at Levo Insight must be truthful, valuable, and actionable. Part of being truthful is being clear about which findings call for action and which don’t. Pretending every number needs a reaction is exactly how owners end up flooded in the first place.